
WONDER AIR
Wonder Fair is a brick-and-mortar store in Lawrence, Kansas. We sell art supplies, stationery, art prints, and a selection of artful gifts and books. Like many other shops, we’ve been navigating the challenges of operating a store amidst a global health pandemic caused by an airborne disease.
We are not public health officials, but it sometimes feels like we are doing that type of work as we attempt to provide a healthy space for our employees, customers, and community.
When the pandemic hit, it was quite easy for (some) businesses to access emergency pandemic relief funding. But as lockdowns ended, information and guidance for safely returning to work was harder to come by. We thought eventually local and national Health Departments might have some new and improved guidelines for us to follow about air quality, sick leave, etc. But... nope! Seems like a missed opportunity!
What follows here is a bit about what we learned and the actions we took as we attempted to make our store a bit safer to the community. Our hope is that by sharing all of this info in an extremely detailed and transparent format, other folks who’d like to make their work- and play-places more safe might benefit from following a similar path...with a big head start!
The Basics
You may have–hopefully–heard some or all of this before, but we’ll go through it just in case since it sets the table for the mitigations strategies we’ll be outlining below.
COVID-19 is an airborne virus. You get it by breathing air, when the air you breathe happens to contain SARS COV-2 viral particles and/or droplets. If your immune system isn’t able to fight off its exposure to those particles, you become sick with COVID, and then you become the person going around, breathing viral particles into the air for others to potentially inhale.
That’s why, in the case of airborne viruses like COVID 19, it is best to avoid sharing contaminated air with sick folks (even asymptomatic sick folks!). Lots of fairly simple things can help you reduce the amount of air you share with sick folks, even sick folks who don’t know they have COVID:
Spending shorter amounts of time in places where exposure is likely (reducing the duration of your exposure).
Increasing the amount of fresh/clean air in places where exposure is likely (reducing the intensity of your exposure).
Wearing a mask. Decreasing the amount of SARS COV-2 particles circulating in the air by asking folks to wear masks reduces the intensity of your exposure and the potential for COVID to spread. Sorry, haters, but years of germ science proves: masks help in many germ-sharing situations with airborne viruses. This should not be controversial. When you wear one, they stop some germs from getting in your mouth and nose when you breathe. Better yet, if you are sick, they stop some of your germs from getting into the air. N95, KN95, or KF94 masks work best both because they provide a tighter fit and, using some very cool science, an electrostatic charge that attracts and pulls particles into the mask fiber itself, keeping those lil buggers out of your mouth. Awesome. But, any mask is better than nothing (even if it’s not a literal germ-capturing magnet).
Staying up-to-date on COVID-19 vaccinations. Vaccines help. They don’t necessarily stop you from getting COVID, but they make it much more likely that you won’t get seriously ill, or need to be hospitalized, or die. If you don’t get sick at all, great. But if you just get a little sick, you’ll be spending less time sick and spreading germs, and the amount of viral load in your body during that shorter duration will also be lower, meaning you’ll be a much less effective germ-spreading machine! Good stuff. This means being up-to-date in your vaccinations lessens BOTH the duration and intensity of other folks’ exposure to SARS-COV-2, and we love a 2-for-1 deal. Speaking of deals... IT’S FREE! Of course, much like a standard flu vaccine, COVID vaccines get less effective over time and as the virus evolves. Usually you have a few good months of strong immunity from circulating strains of the virus, and then vaccine efficacy starts to wane-- probably starting around 3 months. Get your booster shot at least once a year or more frequently if you’re able. Tell everyone you know to get their booster. The booster rates really make us sad. It’s an easy thing to do that has a big public health impact and is a simple way to demonstrate care for literally every person with whom you will be sharing air.
Being mindful of your wellness. If you’re feeling sick, especially if you’re sick with respiratory or gastrointestinal problems that aren’t allergy related, don’t hang out with other people. Doesn’t matter if it’s COVID or something else, like the nasty Norovirus that swept through Lawrence alongside COVID in Winter ‘22-’23. If for some reason you absolutely must hang out with others, for example, if your work or family obligations are inflexible on the matter, wear an N95-quality mask when you go out... at least you’re trying! Better yet...
If you think you might have COVID, you can take a test to check. Test when you have symptoms or 5 days after a known exposure. PCR tests are more accurate than at-home tests, especially now as the virus has evolved into increasingly heavily mutated strains (some scientists suggest that SARS-COV-2 has actually evolved so much in the last three years, we should be considering the current XBB variants “SARS-COV-3”). Orchards Drug (certainly elsewhere also) in Lawrence does free PCR tests without an appointment and you usually get your results within a day or so. If you passed an at-home test, but you’re still worried, just go get the PCR test done for peace of mind. Fun fact! At least as of March 2023, you can get free at-home tests mailed to you by the post office. If you have health insurance you can also get 8 free tests per month. Usually you just have to go to a pharmacy and give them your insurance card and they’ll let you just walk out with 8 tests for free. Sounds too good to be true, but it’s real. We’ve done it. Rapid tests may be a little less sensitive to current variants, which is why if you have symptoms, you’d be wise to test a few days in a row rather than assume you have “just a bad cold” after one negative test.
Washing your hands is good general hygiene, but you’re much more likely to get COVID through breathing air versus surface transmission. Wash your hands anyway because it’s gross if you don’t!
Keep up with the science of airborne transmission as it evolves...even if public health agencies just tell you to wash your hands and stand 6 feet apart. Standing 6 feet apart is not it. Rather than busting out a tape measure, your likelihood of getting COVID can best be measured by the DURATION and INTENSITY of your exposure, as we’ve outlined above. It’s all about the amount of time you’re spending around an infected person, and how much air exchange is happening in the room during that time. So... let’s talk about how we’ve considered all of these mitigating factors and used them to make Wonder Fair a place where the duration and intensity of exposure is extremely low... even if you’re not actually trying to avoid getting covid! We’re doing it for you. Here’s how.
What We’ve Done In Our Store
Wonder Fair is, of course, a pretty small data set, but we feel like we’ve generally had good success in avoiding COVID amongst our staff. Since March 2022, we’ve employed 21 different people in our store. Only 5 of those people ever got sick with COVID during their period of employment. None of those illnesses originated in our shop or were the result of spread between staff members.
When we returned to in-person work, we instituted some new rules for all our co-workers. We don’t let anyone sick come to work. Everyone on our staff has paid sick time. Vaccination against COVID-19 is a precondition of employment and following CDC recommendations for booster shots is a requirement for continued employment. We keep rapid tests on-hand for anyone experiencing any COVID-type symptoms and we have them test into work in those instances. During periods of heavy community spread–like the Omicron wave in early 2022–we employed weekly testing at the start of a person’s work week.
For the first year or so of the pandemic we enforced a capacity limit in our shop and only permitted 15-20 shoppers at any given time. It mostly wasn’t a problem, but some folks may remember standing in line on a busy Saturday or during the holiday shopping season of December 2020. Once vaccines were widely available we ceased enforcing a capacity limit.
Most locals, of course, know us as the place that just kept on requiring masks. The most recent mask mandate in Douglas County expired in early March 2022 following the initial Omicron surge. For a full year after, we continued requiring all customers and staff to wear masks while in the store. We provided free masks to anyone who did not bring one1. Our customers were extraordinarily nice about this mask requirement and we are so grateful for it. We truly do have the most gracious and caring patrons. We would occasionally be visited by someone who was grumpy about it and we may have lost a few customers here and there, but equally as often we got words of encouragement and appreciation for the effort.
As we began to envision a future without required masking, we set out to learn more about our physical space and what improvements could be made to make this space safer, even if people weren’t making a personal choice to wear a mask. The general consensus suggested we focus on indoor air quality. Eventually we did discover that in March 2022 (two years into the pandemic 🤦) the EPA finally issued some guidance on the subject.
The core of the EPA’s guidance suggested we should optimize ventilation and enhance air filtration and cleaning. To do that, we needed to evaluate our existing systems and then work to improve them by filling in any gaps. Unfortunately the EPA doesn’t give any specific guidance about the number of air changes to target in a given building. As we learned more, most places were suggesting at least 4 air changes per hour. The United States’ National Institute of Environmental Health Sciences recommends 5-6 air changes per hour so we set that as a minimum target. Studies show five air changes an hour can reduce transmission risk by 50 percent.
Evaluating Air Exchange Rate
Air changes per hour (ACH), is a calculation of how many times per hour the entire volume of air in a given space is replaced with new air and/or recirculated air that’s been filtered. Because our air is being conditioned (heated or cooled), on most days it’s less energy efficient to continually replace the air in our building with fresh air. So filtration and air recirculation will play a key role in removing or deactivating COVID particles in our environment.
To figure out how many air exchanges we have per hour, we need to know the volume of our space and the handling capacity of any equipment we use to process the air in our building.
To calculate the volume of our space, we measure the height, length and width of our interior space. Wonder Fair is approximately 30,000 cubic feet.
Fresh air comes into Wonder Fair in two ways: through our doors and through our HVAC (Heating, Ventilation, and Air Conditioning) system.
The amount of air exchange from our front and rear doors is difficult to quantify without doing some really impressive calculations. It’s dependent on a whole range of factors: frequency of door openings, air pressure inside and outside, and more. We’re not fluid dynamics experts, so it’s a bit beyond us. But the Airborne Infection Risk Calculator (more on that soon) we use suggests that “for the opening of doors and windows on one side of a room” we can assume that this adds between 1.0–5.0 air changes per hour. We’ll use the lowest figure here since our door is only open irregularly and we have no windows that open. We know that door openings and closing can be a significant contributing factor to air exchange so on nice days or at high-traffic times, we’ll try to prop the door to encourage more air flow. One complication is that our cat Dave likes to explore the outside, so–for his safety–we don’t end up propping the door open as much as we’d like.
Our HVAC system is a real workhorse when it comes to air exchanges. At Wonder Fair we have a split heating and cooling system. One furnace services our entire space during the winter. In the summer months, two different AC units help keep the space cool. One uses the furnace as a blower and the other is on the roof of our back room with its own separate blower.
The great thing about these split systems is that you can just pop in an air filter with a MERV-13 rating or higher and you basically turn your HVAC system into a huge HEPA filter. Using a MERV-13 should filter out about 85% of COVID particles on a single pass. If you’re pushing several air exchanges per hour through this equipment then you’re doing a pretty effective job of eliminating any COVID particles that are present in the air (three passes would capture 99.6% of COVID particles).
To figure out how much air your blower(s) is capable of handling per hour, you usually need to figure out your blower model number, do some googling, and then dig into the details on its service manual or a technical brochure. The number you’re looking for is CFM (Cubic Feet Per Minute). Sometimes they’ll give you this number in metric (m3/hour) rather than cubic feet per minute, so watch out for that and do some conversions if you have to.
Once we know the CFM we can multiply that number by 60 to calculate the Cubic Feet Per Hour (CFH). When we divide that number by the volume of our space (30,000 cubic feet) we can calculate the air changes per hour from each piece of equipment.
The handling capacity of our two HVAC units at Wonder Fair:

Table 1: Structural Air Handling Capacity at Wonder Fair
If these two units are running continuously, they’ll exchange the air in the building approximately 6 times per hour. That’s pretty good! We don’t necessarily run these continuously, but we can. More on that later.
To increase our air changes per hour and to create more effective localized viral mediation in the high traffic areas of the store we have implemented a number of portable air filtration units.
In October 2020 we purchased three Molekule Air Pro units. These models use both mechanical filtration and a coated filter plus UV light to remove and destroy viral particles and other air pollutants. They look nice, but they were pretty expensive (we paid around $1000 each). They have some great built in sensors that monitor local air conditions including volatile organics, CO2, and relative humidity and they can be set to automatically increase their fan speed as conditions worsen. But as we learned more about air filtration, we softened on them a bit. Their air handling capacity is low compared to similarly-sized models and when they operate at their maximum speed they are super loud (up to 65 dBa!). So we started looking for alternatives.
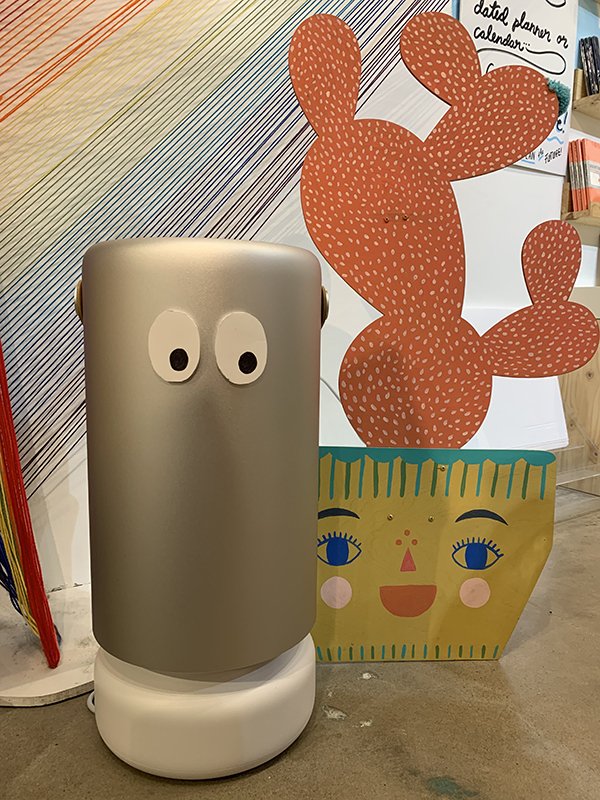
We settled on the BlueAir HealthProtect™ 7700 series. These cost around $700-800 each and they look kinda like cylons. That sci-fi aesthetic is not generally our vibe, but they push tons of air and are about the quietest model we could find. These BlueAir units use traditional mechanical filtration coupled with electrostatic charging of particles as a means of removal and mitigation. They have three fan speeds and, when they’re on max, each unit can produce nearly 1 air change per hour in our space which they do that while running pretty quietly at just 55 decibels (that’s quieter than our Molekule filters by a factor of 10 since the decibel scale is logarithmic). We love our cylons!
We’re currently using our three Molekule Air Pro units along with three BlueAir 7700s, all strategically placed in higher traffic areas of our shop.
Here’s a look at the additional air purification capacity that we’ve added with these portable units:

Table 2: Added air handling capacity at Wonder Fair
And here’s a summary of our total air handling capacity:

Table 3: Total Air Handling Capacity at Wonder Fair (March 2023)
The one assumption behind this total capacity number is that all of these units are continuously running at their maximum speed. That’s not always the case, but even if we are running them at half capacity, we’d fall into the recommended zone of 5-6 air changes per hour. In times of heavy store traffic, we can make simple and quick adjustments to nudge our system toward its maximum air handling capacity. More on this later.
In the absence of indoor air quality standards in the United States, we started to look abroad to learn what other countries were doing. We noticed that several countries had begun requiring public disclosure of indoor air quality, often in the form of a publicly visible carbon dioxide (CO2) meter (we’ll talk more about that later too). In Belgium last year, their federal government established some air quality targets:
Level A: a CO2 concentration lower than 900 ppm (parts per million). Ventilation and/or air purification must therefore be provided at a rate of at least 40 m3 per hour per person.
Level B: a CO2 concentration lower than 1,200 ppm or a ventilation flow of at least 25 m3 per hour per person.
Our max air handling capacity at Wonder Fair would be 8,624 m3 per hour (10.71 ACH x 848 m3 room volume). If we use Belgium’s Level A guidance of 40 m3 per hour per person guidance for air ventilation/purification, then our max capacity calculates to 215 persons. On a typical day, we usually don’t see more than 10-15 people in the store at a given time, and on a busy Saturday or during holiday shopping that number might climb as high as 30-40. In general, it feels pretty reassuring to know we’ll be well below that 215 capacity, lol.
Calculating Risk
In the Community
For the duration of the pandemic we’ve generally made personal risk assessments and store policy decisions based on local metrics of community spread. Tracking of community spread has evolved over the past few years. Prior to 2022, we had local case-count numbers but as the majority of COVID testing moved to the home, those officially reported numbers became unreliable. Indeed, our local health department ceased publishing their 14-day moving-average graph of COVID cases at the end of 2022.
The best metric we currently have in Lawrence, Kansas for evaluating community spread is the wastewater testing that’s being done though WastewaterSCAN which monitors COVID-19 and its variants, alongside monkeypox, influenza A, Norovirus, and RSV. Wastewater numbers are a leading indicator - showing the amount of COVID-19 genetic material present in Lawrence sewage at different times. These levels can be used to predict COVID surges and inform precautionary measures. If we go back to requiring masks in the store, it will most likely be because the COVID wastewater numbers demonstrate that we are experiencing a period of high community transmission.
This is what our COVID wastewater data looks like since data collection began in August 20222:

COVID wastewater monitoring showing data from August 2022 through March 24, 2023
We also keep up with Lawrence-Douglas County Public Health Department, but mostly just for vaccine and booster announcements since they no longer track or publish any data related to COVID-19.
At Wonder Fair
To evaluate the risk of infection in our store environment, we discovered a super helpful tool that takes into account our unique localized variables–the physical dimensions of our space, our air handling capacity, time spent indoors–and provides us with a risk assessment for a number of different airborne pathogens.
The Airborne Infection Risk Calculator (AIRC) was developed by researchers at CUNY BPL, the University of Cassino and Southern Lazio Department of Civil and Mechanical Engineering (Cassino, Italy) and the International Laboratory for Air Quality and Health (ILAQH, Queensland University of Technology, Brisbane, Australia). AIRC is an airborne contagion modeling tool programmed in Microsoft Excel and designed to assist facility managers, building engineers, and public and occupational health professionals in prospectively evaluating individual infection and community transmission risks associated with specific indoor environments.
AIRC can help users address two primary questions related to the risks associated with occupying an indoor space when community transmission of an infectious airborne pathogen, such as SARS-CoV-2, is occurring:
What is the potential infection risk associated with varying lengths of stay in the space?
What number of occupants helps maintain a basic reproduction number (R0) less than one to prevent the exposure from further contributing to disease spread in the population.
If you’re interested in using this tool, the key variables you’ll be messing around with are:
Room Volume (figure out your room area and your ceiling height)
Air Exchange Rate (we covered that above)
Exposure Time
Activity Level (you can choose different activity levels for both susceptible persons and infectious persons from a drop down menu in the Excel sheet)
Number of infectious occupants
Without getting too into the weeds here, this tool basically inputs various indoor environmental conditions to determine a probability of infection with COVID. There’s a handy user manual that explains all the terminology involved and helps you make sure you’re entering all your variables correctly.
Importantly, there are a few assumptions that this calculator uses:
All the calculations here are for unmasked situations. Masking decreases risk significantly. One-way masking (where you wear a mask and the infectious person(s) is unmasked) would lower risk by as much as 80-90% depending on the mask type.
The calculator does not factor in vaccination status or lingering immunity from past COVID infection. We know that in general people experience significant windows of heightened immunity in the months immediately following vaccination or infection and that immunity will wane over time.
Different strains of COVID are more transmissible. This calculator was originally made using transmissibility data for earlier strains of the virus. In the most recent version of the calculator (AIRC (beta 3.0)), an emission multiplier of 2.0 was used for the CoV-2 (V) pathogen calculation to account for the more highly contagious Omicron-based variants currently in circulation compared to earlier strains of SARS-CoV-2. This is a variable you can change should we learn more about the comparative transmissibility of COVID as it evolves.
Both the manual and the Airborne Infection Risk Calculator can be accessed here:
https://nycenergytools.com/resources/tools/airborne-infection-risk-calculator
At Wonder Fair, we’ve used this tool to do two types of risk calculations: one for customers and one for our employees. For all these calculations we’ll be conservative and estimate our air changes per hour to be about half of our maximum capacity since we typically only run our system at full capacity during our busiest shop hours. Our max capacity is 10.71 ACH, so we’ll use 5.35 as our air handling capacity for these calculations.
We’re pleased to report our results are pretty good.
In Scenario 1 (shown below) we have an employee (Continuous Occupant) on an 8 hour shift. One infectious person (Infectious Occupant at Time Zero) enters at the start of their shift and spends 30 minutes in the store3. A second infectious person (Infectious Occupant A) enters halfway through their shift and also spends 30 minutes in the store. During this shift and under these fully unmasked conditions, our employee would experience a 0.36% probability of infection.
In the same scenario, we have a customer (Susceptible Occupant A) whose visit to Wonder Fair completely overlaps with the infected person visiting at Time Zero. This customer’s risk of infection in this scenario is just over 0.1%.

Scenario 1: one contagious customer shops for 30 minutes
We would need to introduce a couple more contagious persons before the customer’s risk of infection reaches 1%.

Scenario 2: three contagious customers shop for 30 minutes
Scenario 2 (shown above) demonstrates that if we had 3 contagious people in the store for about 3 minutes, our other customers would have a 1% probability of infection. It also suggests that we could have nearly 100 people in the store (we won’t) before the basic reproductive number passes 1 and our environment begins contributing to community transmission.
Again, in these scenarios everyone is completely unmasked.
In another scenario we wanted to see what would happen if one of our co-workers were to work an 8-hour shift while contagious. Scenario 3 shows that other workers sharing that shift would have about a 2.75% probability of infection. Customers spending 30 minutes in the store would have a 0.18% probability of infection.

Scenario 3: contagious employee and risk to customers and co-workers
All this left us feeling pretty good about our localized mediation efforts, especially after we used this calculator to invent a scenario where we hung out for a couple hours in a (fake) little bar with not so great ventilation while everyone talked loudly. The level of infection risk in this scenario was between 10 and 100 times higher that what we saw in any of the scenarios we designed for Wonder Fair.

Scenario 4: 1-3 hours spent in a small bar with people talking loudly and not super great ventilation
If you’re interested in messing around with hypothetical scenarios in the Wonder Fair environment, you can download our pre-filled spreadsheet and mess around with the different variables yourself.
Monitoring
We already have a good grasp on the busiest shopping times in our store based on sales data, but we’ve also confirmed it on a molecular level by purchasing a portable carbon dioxide monitor (the Aranet4 HOME for about $250).
We’re interested in monitoring CO2 because infectious people exhale airborne viruses at the same time as they exhale carbon dioxide. That means CO2 can–in a sense–serve as a proxy for the number of viruses in the air. Risk increases with the amount of carbon dioxide in the air simply because it means more people are exhaling in an enclosed space. If that air is not being replaced with new fresh air, then the carbon dioxide level will rise.
Below you can see CO2 levels observed during a typical week at Wonder Fair (left) and a busy Saturday (right).

Image captured at closing time (6pm) on Sunday, Feb 26, 2023

CO2 levels at Wonder Fair for Saturday, January 28, 2023.
Saturday is almost always our busiest day of the week and our busiest hours are typically 12-5pm. During the week above we reached our weekly peak CO2 concentration of 1357 ppm at the tail end of that busy time period on Saturday at 4:51pm. To the right you can see a detailed look at CO2 levels from a typical Saturday in January.
We know our risk increases as more people exhale in our store. We’re mitigating this risk with the 6 portable air filtration units that we run continuously during open hours. These units cannot filter out carbon dioxide, but they will filter out most viral particles. So while the store gets busy and we observe our CO2 levels increase, we can expect that the viral load may increase but that its increase won’t be commensurate with that of CO2.
Our general operating procedure at Wonder Fair is to keep an eye on the CO2 level throughout the day and to make air flow adjustments as needed. As the store gets busier, we can make any and all of the following adjustments.
Increase the fan speed of our portable filtration units
Open our front and/or back door to increase fresh air intake
Set one or both HVAC units so that their blowers are continuously circulating air through their MERV-13 filters
If you’re curious to get a glimpse of the current CO2 level at Wonder Fair, our meter is publicly visible and is located behind the checkout desk on top of the central letter board.

Get a read on CO2 levels at Wonder Fair!
Conclusions
COVID is still out there. If you’d rather not get it, it’s probably best to wear a mask when you’re in busy places and especially if you don’t see visible signs of air quality control (open windows, HEPA air cleaners, etc). Consider keeping a mask handy all the time, for those inevitable moments you end up in a meeting or a movie theater or an airplane next to that one person who just happens to be coughing up a lung. Consider staying home if you feel sick. And most importantly, consider how the sum of our individual choices determines the collective health of our community, and especially its most vulnerable members.
We’ve worked hard to try and make Wonder Fair a safe(r) place to visit. We hope that by showing this work, our customers will also feel safe in our shop. If any of our efforts here have helped you, feel free to leave this tab open for a family member, an employer or co-worker, a classroom leader, or even an air purification enthusiast. I guess now you can consider us members of the latter club.
Stay safe our there (and we’ll try and keep you safe in here)!
Your friends,
Wonder Fair
Footnotes
We spent $3500 on free masks between March 2022–March 2023
Prior to WastewaterSCAN, COVID wastewater numbers were monitored as part of a study contracted through the University of Kansas School of Engineering and the City of Lawrence that conducted weekly sampling of the influent wastewater at both wastewater treatment plants in Lawrence. That study gathered data from June 2020 through June 2022 when the contract was not renewed. This period offers a historic look at the early part of the pandemic prior to the rise of at-home testing when official reporting of positive COVID cases was more robust and likely much more accurate. It gave us a more full picture of community spread. Unfortunately, the WastewaterSCAN numbers are measured using a different method (gene copies per gram of dry solid waste versus the previous method of measuring gene copies per liter) and we don’t have any overlapping data between the two wastewater methods that would allow us to reconcile the two data sets and compare current wastewater numbers to an approximate number of COVID cases in the community. ¯\_(ツ)_/¯
We know through Google’s surveillance system that the average visit to Wonder Fair is 30 minutes.

March 5, 2023 screenshot of Google’s evaluation of average visit time at Wonder Fair.